
Se encuentra usted aquí
Agregador de canales de noticias
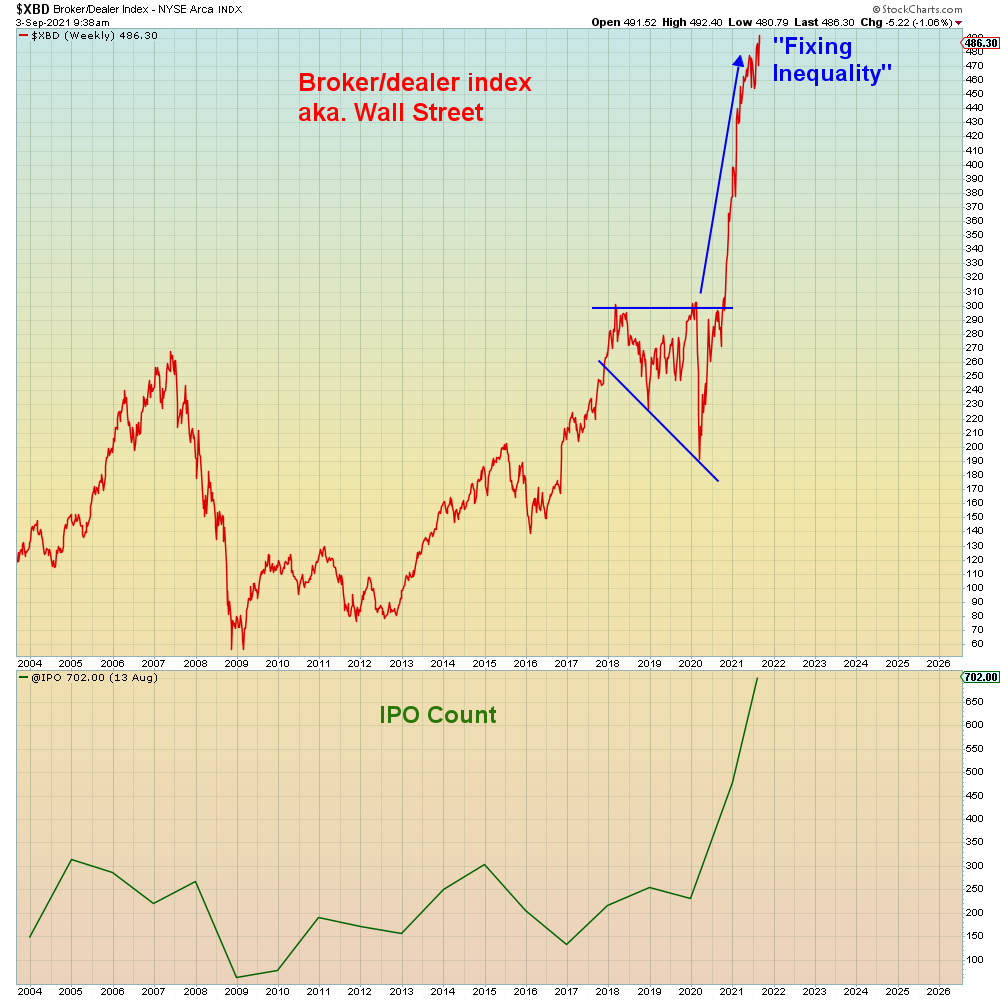
A 100 Year Storm
As we're witnessing in real-time, reality doesn't give a damn what today's denialists "believe". They're being hunted into extinction and they want no warning as to what's coming...
What went wrong? That's the question archaeologists will ask. It's a question that is assiduously avoided by today's de facto Idiocracy. This inherited belief in God given exceptionalism has made this society fat, dumb, and lazy. Denialist ignorance is the path of least resistance, bounding down the continual descent into squalor.
The 100 year storm flooded our basement this week so I spent the past several days fixing the damage and improving the drainage before Noah starts loading the animals onto the Ark for the next round. I am under no illusion that this was a "one time event". Half this country is currently under extreme drought and the other half is under water. Large tracts of housing are now blighted and permanently uninsurable. The square footage per person of U.S. homes doubled in the past fifty years while the population doubled as well. Third grade math indicates the unsustainability of this mass consumption orgy. You don't have to be a genius to figure out "what changed".
Afghanistan is another major example of never ending denialism. Biden should have never attempted to pull out of that country which collapsed like a cheap tent. Held up all these years only by a continuous flow of foreign aid and the permanent U.S. presence. What was he thinking? There was no upside to decisive action. Talk constantly and do nothing, that is the new American way. Now he is receiving the full wrath of two decades of collapsed hubris. He made all of today's "experts" look like the idiots they've been all along. His presidency blighted by honesty.
Which gets me to this ongoing COVID debacle which is being managed in the worst way possible. Half the country that is vaccinated is in a constant state of hysteria over the virus. The other half of the country is unvaccinated and pretending the virus doesn't exist. One side is racing into the virtual reality of the future and the other side is clinging to the blighted past.
One wonders, would so many of these yuppies be enthralled by night after night of COVID hysteria on CNN if it wasn't conducive to a permanent work from home situation? As we got closer to the end of the summer and the dreaded return to the office, back came the masks and the calls for "responsibility". Make no mistake, this is a yuppy paradise - untold numbers of marginally attached gig workers are now attending their every whim while they get rich in the markets sitting at home. We don't need arrays of tall downtown skyscrapers anymore, the iPhone is the new office.
To date, the 100 year storm has yet to reach the placid shores of these central bank managed Disney markets, but it's only a matter of time before the cars are floating down Wall Street as well.
Going into the Labor Day long weekend, the Nasdaq is six months overbought (lower pane), and the beloved virtual economy is tracing out an identical pattern to the February top:
Cyclicals are getting monkey hammered this week, while positioning (lower pane) remains at extremes. JP Morgan put out a note this week saying that retail investor inflows remain at a record high in August.
Chinese stocks have enjoyed a nice bounce, but now we learn that the most leveraged company on the planet is on the verge of default. Investors are assuming the Chinese government will organize a bailout, but given the theme of "Common Prosperity", it's far from a sure bet.
It appears that unlike the U.S. where inequality is the new beloved business model, the Chinese are getting serious about the problem.
"Common prosperity" as an idea is not new in China, but a sharp escalation in official rhetoric and a crackdown on excesses in industries including technology and private tuition has rattled investors in the world's second-largest economy"
Does common prosperity include bailouts for the rich? If it doesn't, then inequality is going to get fixed sooner rather than later.
Ironically, due to the implosion of the real estate sector, Chinese speculators are now speculating in stocks at volumes not seen since the crash of 2015.
"On Wednesday, trading volume in the Shanghai composite was the highest since July 2015, the summer China’s stock market crashed amid high speculation."
Markets should be prepared for what could be a much worse-than-expected growth slowdown, more loan and bond defaults, and potential stock market turmoil"
Or not.
Conversely, the U.S. approach to fixing inequality is to continue to dump insane amount of junk stocks into an extreme overbought market, thus allowing insiders to cash out at public expense.
"The IPO market has already had its busiest year since the internet bubble in 2000"
"After-market performance (the performance after the first day of trading) for IPOs was negative for most of this year. An investor who put money into an IPO after the first day of trading, on average, lost money"
In summary, the question on the table is will human history's biggest pump and dump continue into this Fall and therefore keep the yuppy dream alive?
Or will inconvenient reality burst their bubble?
My prediction is that the inequality reduction will begin overnight in a widely ignored time zone.
Categorías: Blogs y opiniones de economia en ingles
Every Last Molecule – Oil Market Update
He’s arguably the most powerful man in oil, and made a colossal declaration…
Recently, Saudi Arabian Energy Minister, Prince Abdulaziz bin Salman, vowed to drill “every last molecule” and be the last man standing in the oil world.
It’s a bold statement in a world that has become fascinated with hydrocarbon reduction.
Calling consensus building amongst his OPEC counterparts and Russia a “state secret and art” Abdulaziz has orchestrated an impressive return of oil prices since the 2020 pandemic with prices gaining nearly 40% year to date.
This sent the shares of oil producers rocketing higher, many of which are up 50% or more this year.
- KRO subscribers took double digit profits on one oil stock earlier this year. Click here to learn how to become a member.
Global oil production growth has remained muted, while global oil consumption has continued to improve.
This has led to a tighter oil market which has strengthened prices while stabilizing national and corporate balance sheets.
Designed by Abdulaziz, last year OPEC and Russia implemented a massive 9.7 million barrel per day production cut in an effort to thwart massive declines in oil demand and to support crumbling oil prices.
Below is a chart which shows the historical production of OPEC and Russia.
The production cut worked and upon the initiation of global vaccine rollouts, oil demand increased while oil inventories around the world began to decline.
- Today the world is undersupplied by approximately 1 million barrels per day.
It’s a far cry from pandemic demand levels in March-April 2020 when the market was oversupplied by 20 million barrels per day. The chart below shows this dramatic shift in imbalances.
Let’s Look at Oil Inventory…Inventory levels fall when demand is greater than supply.
Barrels normally held in inventory are released to the market to soak up the excess demand.
- Global crude oil inventory levels have declined by over 200 million barrels, and it is forecast that over the next 3-4 months an additional 100 million barrels could leave storage tanks.
Below is a chart which shows this mega build up in global crude oil inventories followed by the subsequent decline after the production cut.
You’ll notice in 2022+ inventory levels are forecast to rise and likely peaking between 2.9 and 3 billion barrels.
Inventory levels in this range indicate a normalized market when compared against demand considerations.
This can be shown through the Days of Demand indicator which is the ratio of crude oil inventory levels to crude oil demand.
Peak Demand + Peak Supply = Peak NonsenseYou will find a lot of extreme sentiment in the oil market these days. It seems that every day there is both “peak demand” and “peak supply” hysteria.
So, who’s right? Probably neither side.
Simply put, if we removed all fossil fuel consumption today, the global economy would crash to a halt. Will we eventually wean ourselves off hydrocarbons?
Absolutely, but it requires slow methodical change, not flipping a light switch. Electric vehicle adoption continues to improve and that is a key driver for future oil consumption.
Though for the next 5-10 years, EVs won’t displace more than a few million barrels per day of demand globally (1-2%).
Don’t Forget: The US Shale FactorThe concept of peak supply is heard just as often. Many questions whether the US shale revolution can continue, or can the Saudi’s really produce enough oil to supply the market? For years I’ve said to never underestimate US shale.
- It takes roughly 6 months to bring a US shale well from initial spud to commercial production.
This creates an incredibly flexible production environment and allows producers to make decisions over much shorter time frames than offshore oil producers or state-owned national oil companies.
Shale is a mature industry now, which means the focus has changed from a “grow at all costs” approach to one of disciplined capital spending and free cash flow generation.
As a mature industry, the years of 20%+ production growth are gone, likely to be replaced with 1-7% annual production growth.
Other segments of US crude oil production will likely tread water.
Alaskan production has not grown in 5 years, while the Gulf of Mexico (GoM) is only up a smidge.
Current oil prices do make economic sense for increased shallow water production in the GoM… but most of this production is controlled by the mega oil corps (Exxon, Chevron, BP, Shell).
As you may know, those companies are under so much environmental scrutiny and forced changes that it is unrealistic to expect large growth in offshore oil.
Thus, it’s unlikely to see the GoM oil production rise significantly.
- Most if not all US oil production growth will come from shale, rather than conventional sources.
OPEC and Russia have considerable excess production capacity which can and will begin to flow back into the markets.
Starting in August 2021, the group will collectively increase production by 400,000 barrels per day. Each month for the rest of the year, the group will add an additional 400,000 barrels per day to the market.
The goal of this slow, disciplined approach is to try to keep oil prices sustained near the $70 per barrel range.
How Much Oil Can OPEC and Russia Bring to the Market?The current OPEC excess capacity is over 8 million barrels.
The largest contributors to future oil supply are Saudi Arabia, Iraq, UAE, and Kuwait. Iran has the capability to also add 2+ million barrels per day of supply but this hinges on their Nuclear deal with the US. Furthermore, Russia has at minimum 1 million barrels of additional capacity available.
Even if you exclude any of the smaller OPEC nations citing poor infrastructure, just the core group of Saudi Arabia, Russia, U.A.E, Iraq and Kuwait provides nearly 6.5 million barrels of spare capacity.
This is enough to satisfy the incremental global demand growth for several years.
Huff & PuffYou will hear a lot about ‘Huff & Puff’ technology in the coming years in the oil patch. Contrary to what many may try to sell you on, it’s not new technology.
In the U.S. you will start to see more oil produced through Enhance Oil Recovery techniques. Specifically, this “Huff & Puff” technology which uses CO2 injection to pressurize the formation and bring oil to the surface.
- This CO2 injection is eligible for a tax credit under the 45Q tax code.
I’ve done a lot of number crunching this and I don’t see (barring some new breakthrough that is many years away) the carbon credit cost being less than USD$40/t in the most optimistic model in oil patch.
That gives us some framework at what price oil companies will be forced to pay for offsets.
And if you’re not factoring that into your investment portfolio yet… you’re going to fall behind.
Subscribers to the KRO – my premium research service know the oil companies I’m targeting and how I’m playing the Net Zero world in a big way.
- I’ve actually found a company that where the CO2 used to produce its oil is equivalent to taking 8 million cars off the road for a year.
Members have the ticker and all the info – click here to get on the list.
Regards,
Marin
The post Every Last Molecule – Oil Market Update appeared first on Katusa Research.
Categorías: Blogs y foros de trabajar madera en ingles
How I’m Thinking About the Shiller P/E
The Shiller P/E (or CAPE ratio) since 1881
A Maddening Ratio
The Shiller P/E (or CAPE) is a measure of market valuations developed by Nobel-prize winner Robert Shiller. It smooths out earnings over 10 years (because earnings are extraordinarily volatile in the short run) and then compares them to market prices. You can check out the data for free, right here.
The Shiller P/E is a metric that has long maddened me. This is because I used it wrong. I thought that the Shiller P/E could be used as a tool to predict the market and that’s not really what it does.
I’ve long looked at it in the context of ‘the bigger they are, the harder they fall.’ I thought that the Shiller P/E could be used as a prediction tool. That’s not really how it works.
My History With the Ratio
As a teen in the ’90s, I was a bulled-up internet bubble believer who was lucky enough to come across ‘The Intelligent Investor’ in the summer of 2000. I looked at the prices, thought they were crazy in the context of Ben Graham, and then I got out.
Of course, Ben Graham was new to me at the time. I never fully appreciated the frustration of people who used a price-to-multiple approach through the 1990’s.
CAPE became expensive in historical terms in the early 1990’s. Someone using that approach would have been maddened by the insanity that happened for the rest of the decade. Someone using that classic approach missed out on most of the ’90s bull market.
I simply was lucky enough to discover value investing at exactly the right time. My timing gave me a flawed sense of confidence in predicting markets.
Throughout the 2010’s, I looked at a rising CAPE ratio and assumed this was all going to crash, eventually. I’d tell people I didn’t know for sure – but I didn’t really believe that in my bones.
Of course, I didn’t think this would happen on its own. My theory was that a catalyst was necessary to make CAPE crash. Historically, the catalyst is typically a recession.
I thought you could predict recessions with the yield curve, which is a reliable indicator. Once a frothy market like the US runs into a recession, the CAPE ratio will mean revert.
When COVID came along, I thought this was the ticket. This was the catalyst that was going to make the Shiller PE mean revert.
As anyone who follows this blog knows, that didn’t happen. CAPE only got down to 24x. This is hardly ‘cheap’ in any historical context. I figured – at the very least – it would get down to 15x. That was around the low reached in 2009.
(Interestingly, the 2009 low wasn’t even particularly ‘cheap,’ either. The average CAPE ratio since 1881 has been 17.)
The Trouble With Historical Multiples
Since 1881, CAPE has gyrated between a low of 4.78 (1920) and the high of 44.2 (1999).
More recently, in 1980, it reached a low of 8.1. This was mainly because interest rates were at all-time-highs in the context of thousands of years of human history.
Looking at a historical chart, timing the market with CAPE looks easy. Sell when you’re at all-time highs in 2000. Buy when in the single-digits in the early 1980’s. Smoke a fat cigar and laugh at the idiots who bought at the highs and didn’t recognize the opportunity at the lows.
Unfortunately, as I have discovered the hard way, that’s not how the real world actually works.
When is it at the high? When is the low? There is no one who can tell you when that is. Alan Greenspan talked about ‘irrational exuberance’ in 1996. That looked like the top to a lot of people and it was not. The market looked cheap compared to the ’90s and 2000’s in the summer of 2008, but it had much further to fall.
The average throughout history is 17. Since 1995, the US market has only spent 3.2% of the time below 17. Imagine if you only invested in stocks when they were below the average.
Literally, the only time you would have invested since ’95 is 3% of the time. Meanwhile, since ’95, the US stock market has turned $10,000 into $162,188.
At this point, if you’ve been bearish since ’95, the market needs to fall 95% for you to be vindicated. That’s probably not going to happen. (Insert long perma bear rant about the Fed and how everything is doomed and it’s all a big Ponzi scheme house of cards.)
If it does fall 95%, I guarantee you that something so horrific is happening in the world that the size of your portfolio probably doesn’t matter much and we are likely entering a Mad Max style hellscape. Stock up on your ammo.
The Long Term is Longer Than You Think
The S&P 500 has historically grown earnings at about a 6% clip. Let’s say it does that for the next decade. We’ll get a 6% return plus dividends, right?
The actual growth isn’t the full story, though. What multiple will investors be willing to pay for those earnings?
That, my friend, is key and it is totally and completely unpredictable.
Let’s say that it gets down to 22 by 2031. The 6% growth should have resulted in 79% growth.
Unfortunately, the mean reversion of the multiple created a lost decade for US stocks even while the fundamentals grew.
What will the 2031 multiple be? It’s impossible to say. It could stay 40 and we’ll actually earn the growth rate of the companies within the index. If we have a Japan moment, it could go up to 100. It could crash down to 10, again. It’s all totally unpredictable.
The multiple 10 years from now depends on what inflation, growth, and interest rates will be. It will depend on the quality of the companies within the index. If they’re growing fast and have fat margins, a higher multiple can be justified. It’s also possible that the quality of companies deteriorates over the next 10 years. No one knows what is going to happen.
When viewed through the context of the total unpredictability of all of these factors, it’s clear that it’s virtually impossible to predict returns 10 years out, let alone 1 year out or 6 months from now.
I mentioned earlier that the S&P 500 has historically grown earnings at a 6% clip. I think an investor with a truly long time horizon (40 years, for instance) is likely to capture that growth plus dividends.
Everyone likes to say that they have these time horizons, but I don’t believe them. I think most people think of ‘long term’ as 5 or 10 years, but the investment outcomes over those time horizons are totally unpredictable.
The crazy fact is that 10 years is short term in the context of market history.
How I Learned To Stop Worrying and Trust the Weird Portfolio
This realization – that the future is totally unpredictable – has made me gravitate towards an asset allocation that ought to be able to deliver a return across a 10-year time horizon regardless of what happens to the macro-economy. For me, the solution was the weird portfolio.
I’m naturally a pessimist. I try to be optimistic, but I can’t help myself. I listen to someone like Peter Schiff and my natural inclination is to hoard gold bars and ammo. I listen to an optimist like Cathie Wood and my natural inclination is to scoff and assume she has her head in the clouds. Of course, Cathie Wood’s philosophy has worked out a lot better than Peter Schiff’s in the last decade. Which philosophy will win out over the next? I have no idea.
That’s why a conservative asset allocation was so useful for me. Are we going to have a deflationary bust? Alright, I own some long term treasuries. Are we going to have hyperinflation and USD collapse? Well, I have some gold and real estate. Is the multiple going to mean revert slowly over the next decade without ending the world? Well, my stock exposure is tilted to small cap value, which should be somewhat insulated from that mean reversion.
Investing in a diversified approach has helped me to stop worrying about the Shiller PE and our impending doom. Instead, I can methodically save & invest for my future.
I’m glad that I developed this approach before COVID. I kept most of my money in that approach. When COVID hit, I acted correctly with the money that I had invested in the weird portfolio.
For the account that I track on this blog, I expressed my opinions about what the market would do.
My opinion wasn’t worth much. The Shiller PE wasn’t worth much as an analysis tool during that time.
I feel fortunate to have discovered an asset allocation that I’m comfortable with that helped me stop worrying about the Shiller PE.
What works for you? That’s really a question you have to answer for yourself. Are you an optimist? Are you a pessimist? What are your goals? How far out are they?
While I don’t know the right asset allocation for everyone, I have concluded that using CAPE as a market timing tool is a flawed concept. Hopefully people can learn this lesson on my dime.
You will not time the market correctly and smoke a fat cigar while laughing at the idiots, I assure you.
Or – maybe you can, in which case, enjoy the smoky Cuban goodness – but that’s probably not gonna happen.
Random
PLEASE NOTE: The information provided on this site is not financial advice and it is for informational and discussion purposes only. Do your own homework. Read the full disclaimer.
Categorías: Blogs y opiniones de economia en ingles
German election diary: Laschet lashes out; vote for die Urbane?
A weekly dispatch from the race for the Bundestag
Categorías: 3 Noticias economicas ingles
Suga Yoshihide steps down as Japan’s prime minister
A period of political uncertainty lies ahead
Categorías: 3 Noticias economicas ingles
Siete 'apps' para aumentar la productividad y evitar el estrés en la vuelta al trabajo
La organización gracias a las aplicaciones de gestión de tareas puede ser una gran aliada. Leer
Categorías: 1 Noticias economicas en español
What the travails of a reformist governor say about Nigeria
Nasir El-Rufai is cutting the workforce to modernise, but faces a backlash from unions
Categorías: 3 Noticias economicas ingles
Israel’s foreign policy has changed in tone but not in substance
It is unlikely to engage with the Palestinians
Categorías: 3 Noticias economicas ingles
Arab states are wrecking old treasures
One dam can flood hundreds of ancient sites
Categorías: 3 Noticias economicas ingles
America should engage with the Taliban, very cautiously
The aim should be to help ordinary Afghans, not to compete with China and Iran
Categorías: 3 Noticias economicas ingles
Germany’s election, seen through the bottom of a glass
Conservative Bavarians and left-wing Berliners agree on beer but little else
Categorías: 3 Noticias economicas ingles
Europe’s latest migrant crisis leaves refugees stuck between two borders
New barriers have been erected on the frontier with Belarus
Categorías: 3 Noticias economicas ingles
Xi Jinping Thought, for children
China rolls out new textbooks on the supreme leader’s political philosophy
Categorías: 3 Noticias economicas ingles
An electric-vehicle startup aims for a stellar valuation
Rivian motors towards an IPO
Categorías: 3 Noticias economicas ingles
The trial of Elizabeth Holmes gets under way
The former boss of a notorious failed health-care startup could face jail
Categorías: 3 Noticias economicas ingles
Britain’s economic recovery from the pandemic is far from smooth
Demand has recovered much faster than supply. That is causing shortages and bottlenecks
Categorías: 3 Noticias economicas ingles
The coming Brexit row over data
Britain plans to trim European online-privacy laws
Categorías: 3 Noticias economicas ingles
Could Canada’s Conservative Party win back power?
Erin O’Toole wants to win over centrist voters on September 20th
Categorías: 3 Noticias economicas ingles
After Afghanistan, Europe wonders if France was right about America
Emmanuel Macron argued the US could not be relied upon. He may have had a point
Categorías: 3 Noticias economicas ingles
Foreign powers ponder how and whether to engage with the Taliban
The new rulers of Afghanistan crave recognition and cash
Categorías: 3 Noticias economicas ingles
Páginas

Custom Search